CID Cytoscape User's Manual
The CID Cytoscape Plugin lets you import data from CID (CISBAN Interactomes Database) into Cytoscape. CID that contains integrated interactomes of different model organisms used in ageing research.
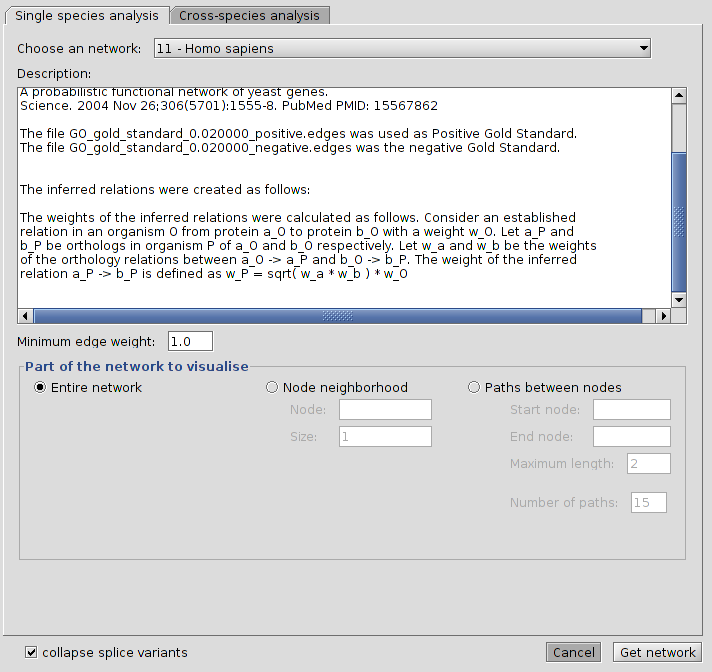 |
| CID Plugin window loaded in Cytoscape |
Availability
Installation
Before attempting to install the CID plugin, you should have been provided with the following file:
- cid_plugindate.zip
Where date is the date of the release, e.g. cid_plugin20110225.zip for 2 Feb 2011. Once you have this file, you are ready to proceed with the installation.
-
Before you start, make sure Cytoscape is not running on your computer.
-
Extract cid_plugin20110225.zip. You should see a folder called "CID Plugin" containing two files:
-
postgresql-8.1-413.jdbc3.jar: a helper module that allows the plugin to talk to the database -
CIDPlugin-1.0-SNAPSHOT.jar: the actual code for the plugin
-
-
Locate the Cytoscape installation folder on your computer. This folder is named after the version of Cytoscape. For instance, if you have version 2.6.2 then the folder will be called Cytoscape_v2.6.2. On Mac OS X, this folder is typically located under the Applications folder. On Windows, you might want to look in the Program Files folder or any other location you installed Cytoscape in. On Linux, Cytoscape tends to live in /usr/local/cytoscape.
-
Inside your Cytoscape installation folder, there is a folder called "plugins". Copy the two files (
postgresql-8.1-413.jdbc3.jarandCIDPlugin-1.0-SNAPSHOT.jar) into the plugins folder of your Cytoscape installation folder. Make sure you copy both files directly and not the folder "cid_plugin20100225". -
When you next start Cytoscape, there should now be a menu item named "CID" in the Plugins menu with two sub-menu items: 'Load CID Network' and 'Configuration' .
Help! My installation wasn't successful!
-
Stay calm!
-
Contact the CISBAN helpdesk for help.
Starting the plugin
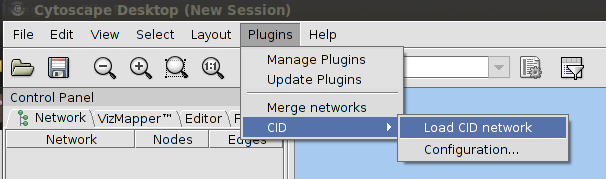 |
| Cytoscape menu bar highlighting the CID menu option |
Easy! Just go to the Plugins Menu and select the CID > Load CID Network menu item. A dialog window should appear. In that window there are two tabs you can choose from. The first tab says "Single species analysis". Choose this one if you only want to retrieve data for a single organism. The second, "Cross-species analysis" can be used when you want to compare networks between different species.
Single species analysis
There are three ways to retrieve data for a single organism:
-
Load the complete integrated network for an organism
-
Retrieve the neighbourhood, i.e. all the interaction partners, of a specific gene.
-
Calculate all paths between two specific genes.
Depending on what you want to do, you want to prefer one type over the other. If you're not sure however, it's best to use a network that contains both types of data.
Loading a complete network
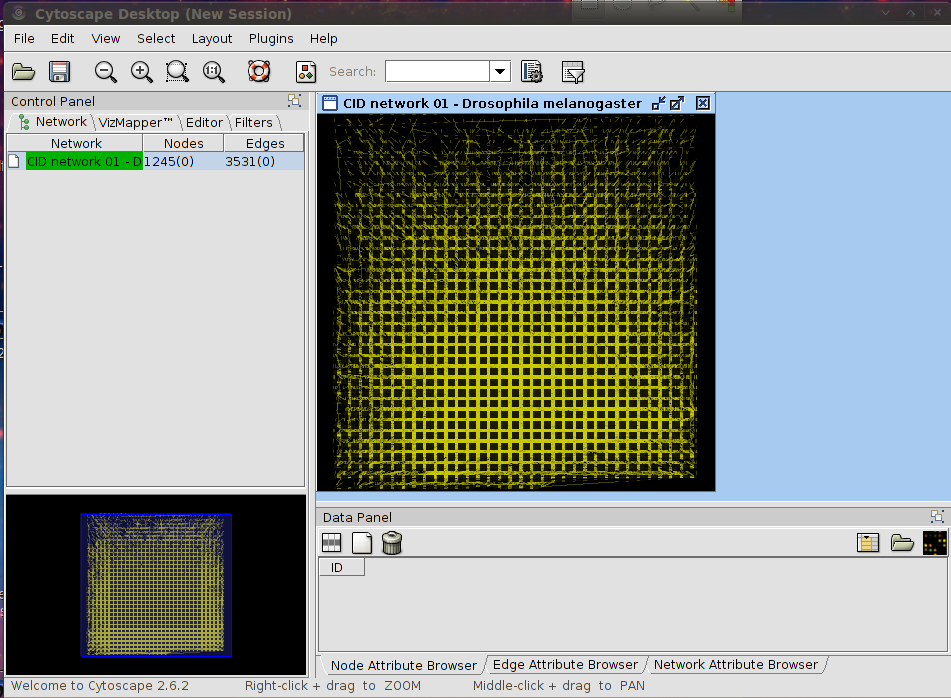 |
| Complete D. melanogaster network loaded by CID |
WARNING: Loading a complete network may require a lot of memory. It is not recommended to load a network with many interactions if you have 2GB or less of RAM. Check the table below to see how many interactions the network for each organism has. Note that these numbers may change in the future.
Currently, CID contains interactions, annotations and other data from 44 different sources. These data have been integrated and inferred to produce the following integrated networks:
| Organism | Interactions from literature | Total number of interactions |
|---|---|---|
| Caenorhabditis elegans | 24376 | 781494 |
| Danio rerio | 10 | 1666261 |
| Dictyostelium discoideum | 0 | 391354 |
| Drosophila melanogaster | 8624 | 1438520 |
| Homo sapiens | 527796 | 1568535 |
| Mus musculus | 46834 | 1685799 |
| Paramecium tetraurelia strain d4-2 | 0 | 1499834 |
| Podospora anserina | 0 | 410642 |
| Rattus norvegicus | 52385 | 1236548 |
| Saccharomyces cerevisiae | 401563 | 475299 |
| Schizosaccharomyces pombe | 3027 | 432529 |
To load a complete network:
-
Select a network from the "Choose a network" drop down list.
-
Check the radio button labeled "Entire network"
-
Click the button that says "Get network".
The plugin will now retrieve the network from the database.
Retrieving the neighbourhood of a gene
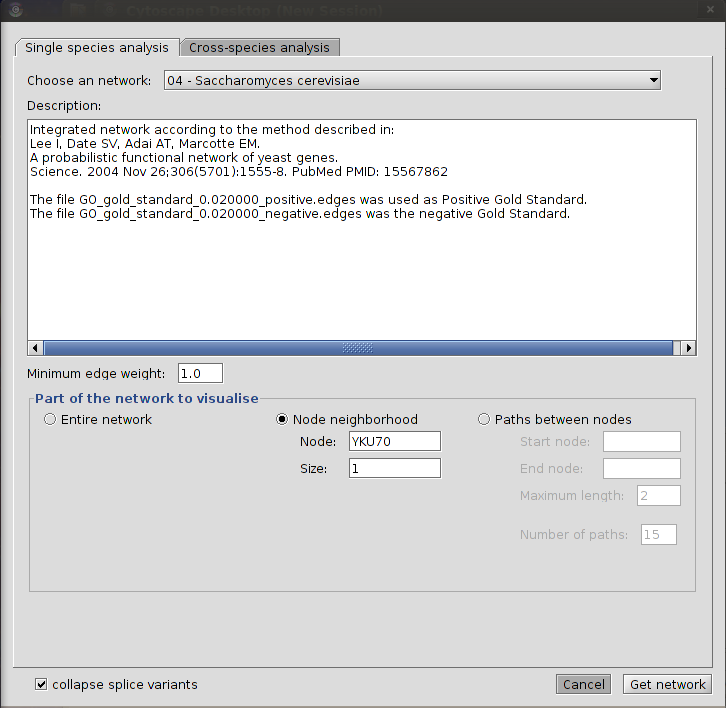 |
| Loading the immediate neighbours of the S. cerevisae gene YKU70 |
-
Select the organism from the "Choose an organism" drop down list.
-
Check the radio button labeled "Node neighbourhood"
-
Fill in the name of the gene in the text box labeled "Node" for which you want to retrieve the neighbourhood. Make sure this is a gene from the organism you've selected in step 1.
-
Fill in the size of the neighbourhood that you want to retrieve in the field labeled "Size". A neighbourhood of size 1 means that you only want to retrieve the direct interaction partners of the specified gene, i.e. only one edge 'away'; from the central gene. Size 2 means you want to retrieve all genes up to 2 edges 'away', and so on. WARNING: Setting the neighbourhood size to a value of 3 or more may result in a very large network being retrieved which may cause your computer to run out of memory. You first might want to retrieve smaller neighbourhoods and try again later with a higher size setting.
-
Click "Get network" to retrieve the neighbourhood. If the gene you specified could not be found in the database or if the gene you specified does not have any interaction partners, you will get a notification. If not, the network will be displayed.
Calculating all paths between two genes
A 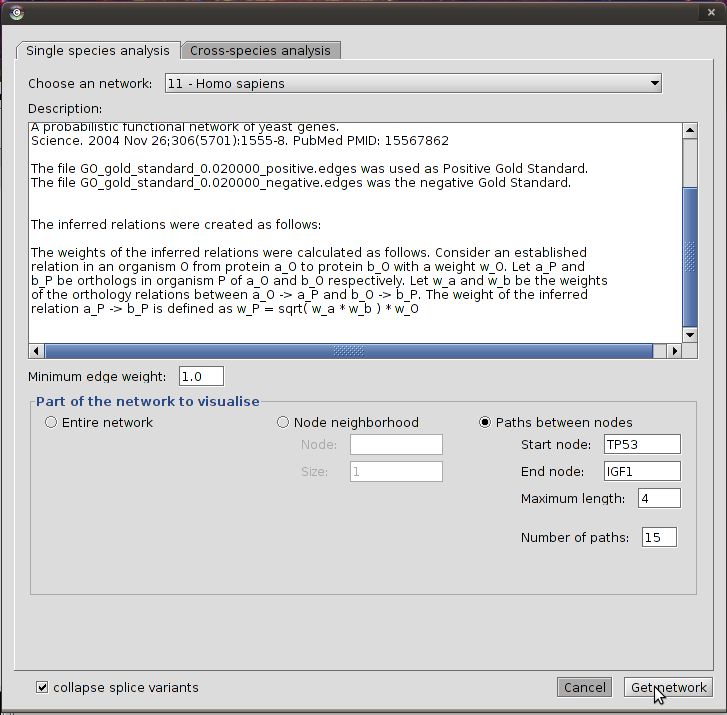 |
B  |
A CID Dialog showing the settings to B Resulting Cytoscape network from the |
This option allows the calculation of all paths between two genes. This function is useful when you know that two genes are involved in the same pathway, but you do not know the exact interactions that regulate both. The plugin will calculate all possible paths up to a given length. For each path a score is calculated by averaging the scores of the individual edges in the path. The best-scoring paths are then returned and visualised in Cytoscape.
This function is an automated version of the pathway analysis performed in Joao Passos et al in Age (2009) 31:353-363.
To calculate the best scoring paths between two genes, follow these steps:
-
Select the organism from the "Choose an organism" drop down list.
-
Check the radio button labeled "Paths between nodes"
-
Fill in the start gene of the pathway in the field labeled "Start node" and the end gene in field labeled "End node"
-
Set the maximum path length in the field labeled "Maximum length". This is the maximum number of links allowed between the start gene and the end gene. Beware that calculating paths of length 6 or more may take a long time to compute, up to several hours. It is best to first calculate all paths of a smaller length and only try bigger values if no paths could be found or if the results are not satisfactory.
-
Set the number of paths to be returned after calculation in the "Number of paths" field. For instance, if you set this value to 10, only the 10 best scoring paths will be returned.
-
Click "Get network" to retrieve all paths. You will get a message if one of the specified gene names could not be found in the database, if one of the genes has no neighbours, or if no paths could be found. Otherwise, a network will be displayed upon completion.
Cross-species analysis
A 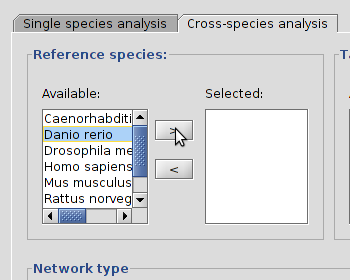 |
B 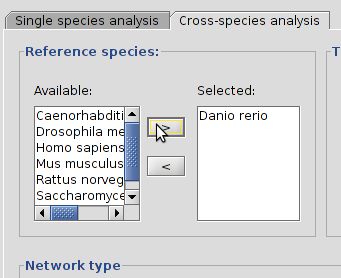 |
| Selecting a species from the table, D. rerio, and pressing the > button (A) will set it as a reference species (B). |
Each of the different types of analysis in cross-species analysis is based on the same principle: a reference network is created for one or more reference organisms. This network is then extended through orthology links to one or more target species.
Reference and target species
You first need to choose one or more reference organisms and one or more target organisms. You can choose reference organisms by selecting one or more species from the list under "Available:" in the "Reference species" frame and then click on the > button to move these to the "Selected" box. You can deselect an organism by clicking its name in the "Selected box" and then clicking the < button. Selecting and deselecting target organism works in exactly the same way.
Node neighbourhood and paths between nodes
These functions do exactly the same as they do in the single species analysis, only is the reference network extended to all target species. Note that you can only use a single reference organism for this type of analysis.
Retrieving all interactions between a set of genes
This function creates a network between a specified set of genes for one or more reference organisms and then extends this network to all target species. There are two different ways to specify the set of genes.
The first way is to specify a set of gene or protein identifiers. Typically, these can be a set of genes of proteins identified in a gene expression (e.g. microarray) or proteomics experiment. To retrieve the interactions between these, following these steps:
A 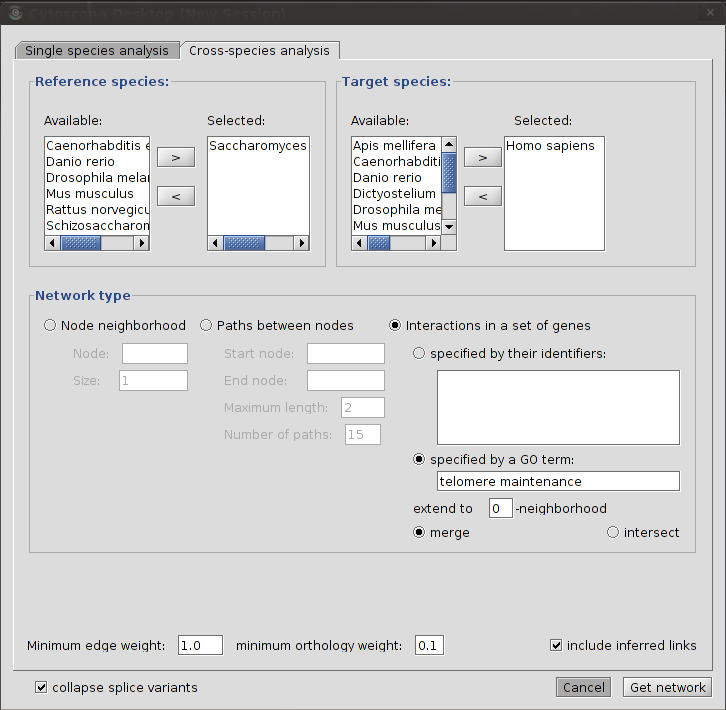 |
B 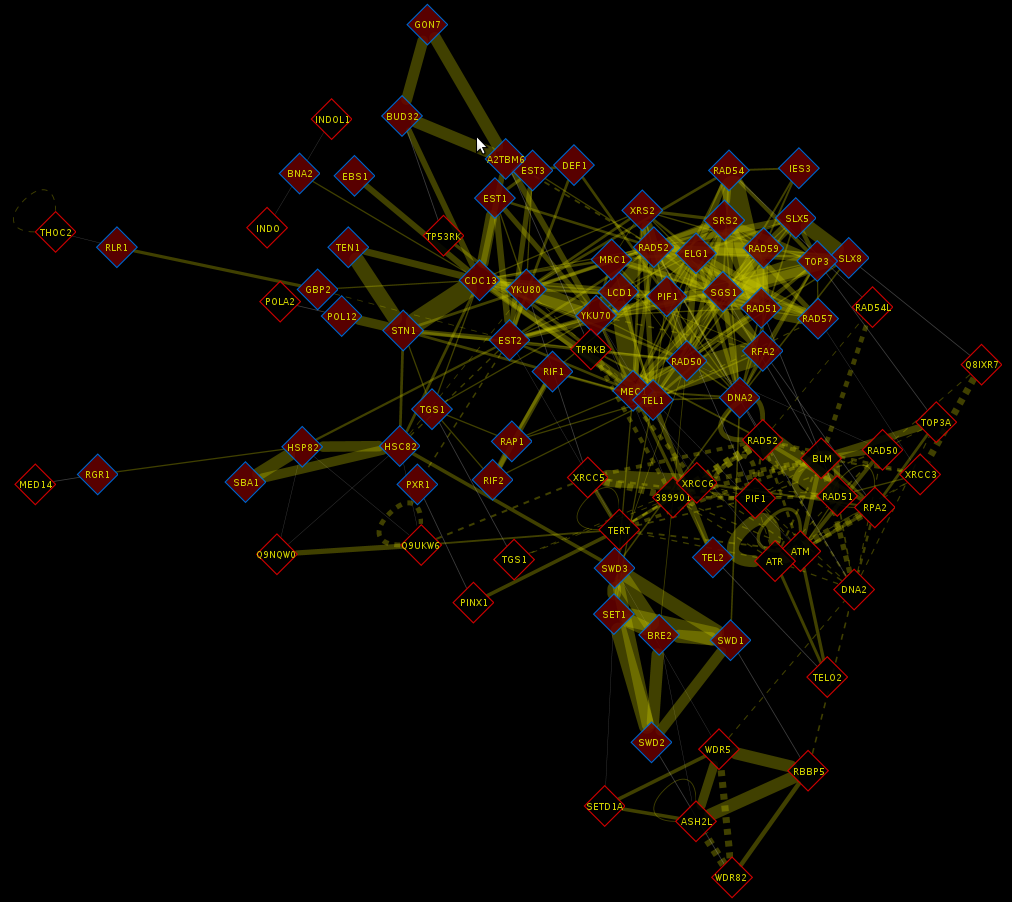 |
A CID Dialog showing the settings to B Resulting Cytoscape network from the |
- Select the desired reference and target organisms.
- Select the "Interactions in a set of genes" radio button.
- Select the "Specified by their identifiers" radio button.
- Paste in a list of identifiers (one per line) in the text box under the radio button. You can mix the identifiers of different organisms in the same list. Make sure though you have selected these organisms as reference organisms.
- If the list of genes you specified is small, you can include the neighborhoods of the genes in your list as well by entering a number greater than 0 in the text box where it says "extend to -neighborhood". If you enter 1, the 1-neighborhood of each gene will be retrieved, if you enter 2, the 2-neighborhood will be retrieved and so on. Again, be careful with the value you enter here as you might get a very big network. It's best to try first with 0-neighborhood (just the genes themselves) and then extend if the retrieved network is not what you expected.
- Click "Get network" to retrieve the network. If you have selected a large number of organisms, this may take a while.
The second way is to enter a GO term. The program will then retrieve all genes in all the specified reference organisms that are annotated with this term and all interactions between them. This network is then extended to the target organisms. Follow these steps to do so:
- Select the desired reference and target organisms.
- Select the "Interactions in a set of genes" radio button.
- Select the "specified by a GO term:" radio button
- Enter a GO term in the text field below. You can use either the GO code (e.g. "GO:0007568") or the name of the GO term (e.g. "aging").
- Here also, you can extend the reference network by including the neighborhoods of the genes that are annotated with the specified term. entering a number greater than 0 in the text box where it says "extend to -neighborhood". If you enter 1, the 1-neighborhood of each gene will be retrieved, if you enter 2, the 2-neighborhood will be retrieved and so on. Again, be careful with the value you enter here as you might get a very big network. It's best to try first with 0-neighborhood (just the genes themselves) and then extend if the retrieved network is not what you expected.
- Click "Get network" to retrieve the network. If you have selected a large number of organisms, this may take a while.
Viewing the data & applying a layout
After you have retrieved the data, you will see that all the nodes of your network are arranged in a grid. Typically you will want to change the layout.
-
For entire networks and large node neighbourhoods, the best options are:
-
Layout → Cytoscape layouts → Edge-weighted Spring Embedded → weight
-
Layout → Cytoscape layouts → Force-Directed Layout → weight
-
- For networks with information from multiple species, it's best to use :
- Layout → Cytoscape layouts → Group Attributes Layout → organism
-
For small node neighbourhoods, you also might want to use:
-
Layout → yFiles → Orthogonal
-
-
For paths between two genes, you can get nice results by using:
-
Layout → Cytoscape layouts → Hierarchical Layout
-
The CID plugin sets a number of attributes that may prove useful when using Cytoscape's vizMapper or for understanding the data.
- Nodes
- DB_ids: used by the CID plugin to keep track of alternative splice variants
- canonicalName: the shortest alias for the gene with the most letters
- partOfInputSet: if this node was one of the ones that was originally queried for. The canonicalName of this node may be different than the one you queried for.
- organism: the organism from which this gene originates
- Edges
- interaction: 'pp' stands for protein-protein interaction; 'ortholog' indicates an orthology relationship
- isDirectional: whether the interaction is directional, e.g. a transcription factor and its binding site
- isEstablished: whether there is literature or public databases that support the existence of this interaction
- isInferred: whether CID predicted that this interaction exists
- pathIDs: when finding a path between two genes, this list indicates which pathways a gene is part of.
- pathWeight:the highest path weight of the paths this gene is part of. For example, gene A is involved in paths 1 and 2, with path 1 weighted at 1.5 and path 2 weighted at 2. The pathWeight attribute for gene A would be 2.
- pubmed_id: the publications that support the existence of this interaction, or the publications that support the existence of an orthologous interaction in other organisms.
- weight: the confidence in the existence of this interaction
Saving your data
You can save the network data you have retrieved and any layout and visual styles you may have applied using File → Save.
More information.
See the Cytoscape manual for more information on how to further analyse your network. The tutorial also includes a section on how to overlay network data with expression data and on how to create visual styles.
Limitations
-
The software is still in alpha version. That's alpha as in before beta-version. Not as in alpha-male :-). This means that there still might be some bugs in it and not everything is quite finished. This also means that if you feel some features are missing, please email the CISBAN helpdesk.
-
At the moment it is not possible to view the gene annotation or interaction type.
Supported by: